Welcome back. Three charts this week, then what CPI did, which is what I promised last Monday. Every number is recomputed from the daily data, and the sources are at the bottom.
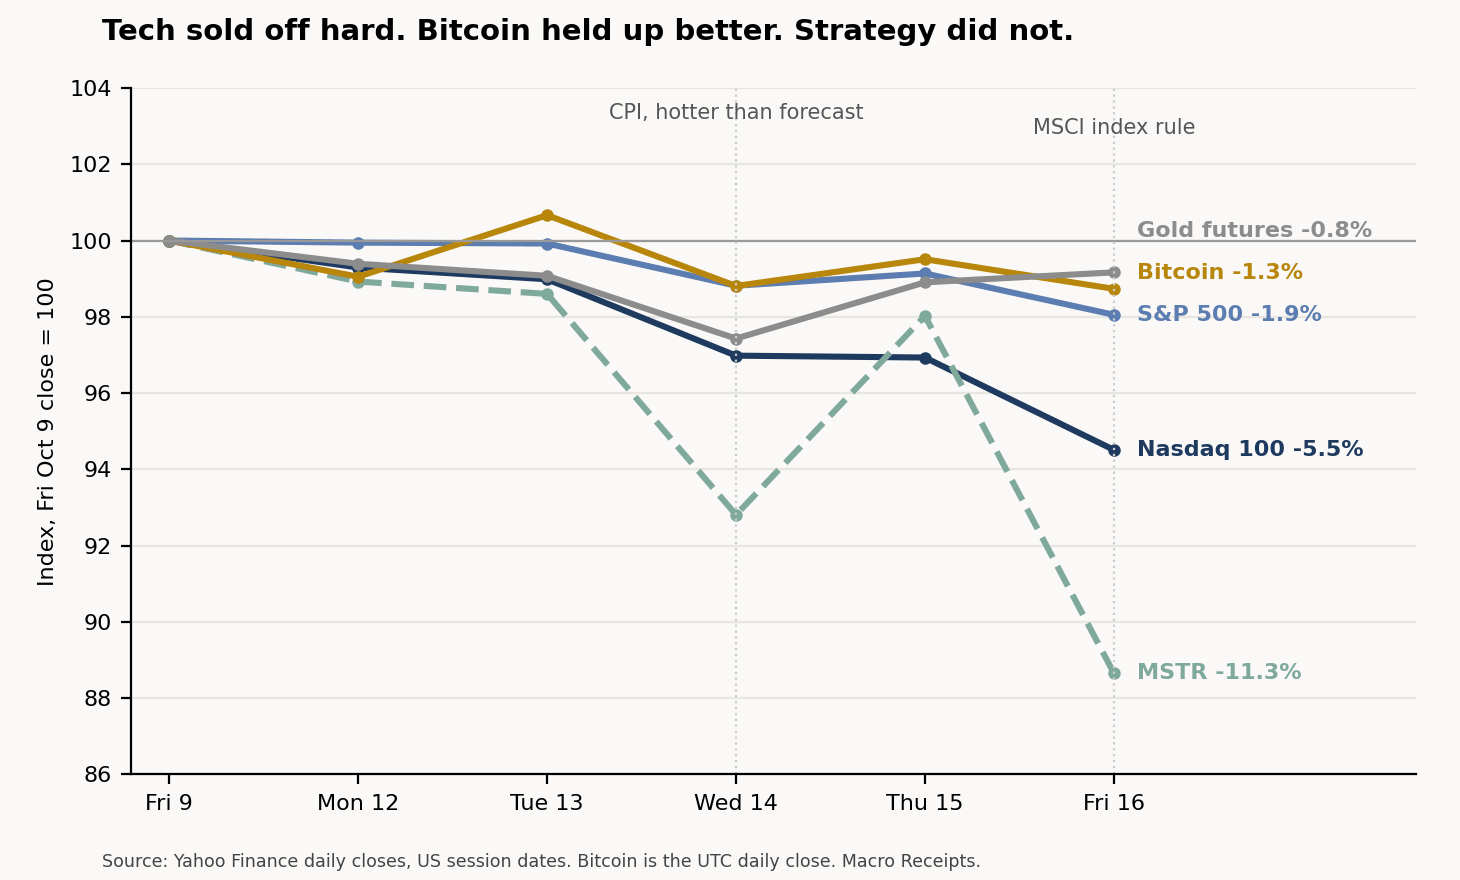
The Nasdaq 100 lost 5.5% on the week and the S&P 500 lost 1.9%. Bitcoin fell 1.3%. MSTR, the company that holds a pile of it, fell 11.3%, including 9.6% on Friday alone.
Bitcoin vs the Mag 7, in dollars
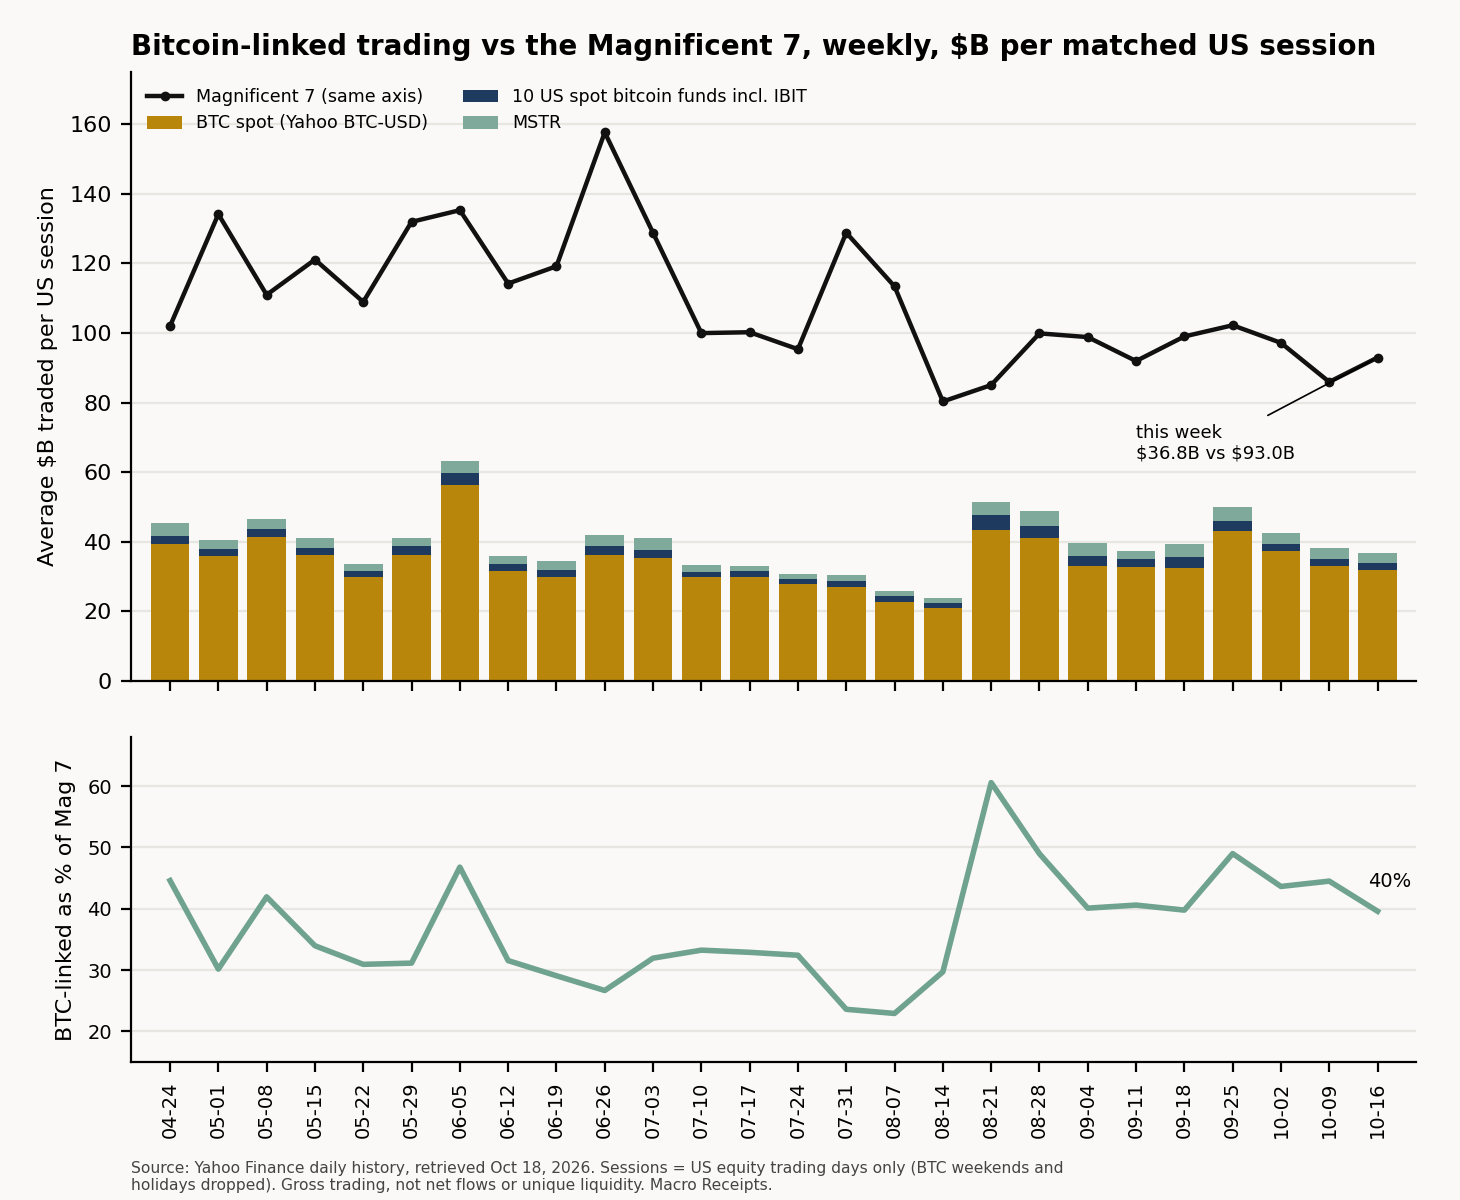
Bitcoin-linked trading averaged $36.8 billion per session this week: $31.9 billion in spot, $2.92 billion in MSTR, and $1.97 billion across the funds, of which IBIT was $1.63 billion. The Mag 7 averaged $93.0 billion, up 8.1% from last week.
That makes bitcoin-linked trading 39.6% of the Mag 7, down from 44.5% last week and about even with the 13-week average of 39.1%. The bars say the same thing without the ratio. Bitcoin-linked trading was 3.8% below last week and 3.7% below its own 12-week average, and $36.8 billion is about 20% under the $46.1 billion 200-session average I used in Issue 2. The funds were the quiet part, 20% below their 12-week average. MSTR was 2.2% above its. The busiest session was Thursday, at $47.6 billion.
The pushback: "bitcoin decoupled from tech"
I saw this line a few times after Friday. Bitcoin fell 1.3% while the Nasdaq 100 fell 5.5%, so the story goes that bitcoin has cut the cord. The data does not say that.
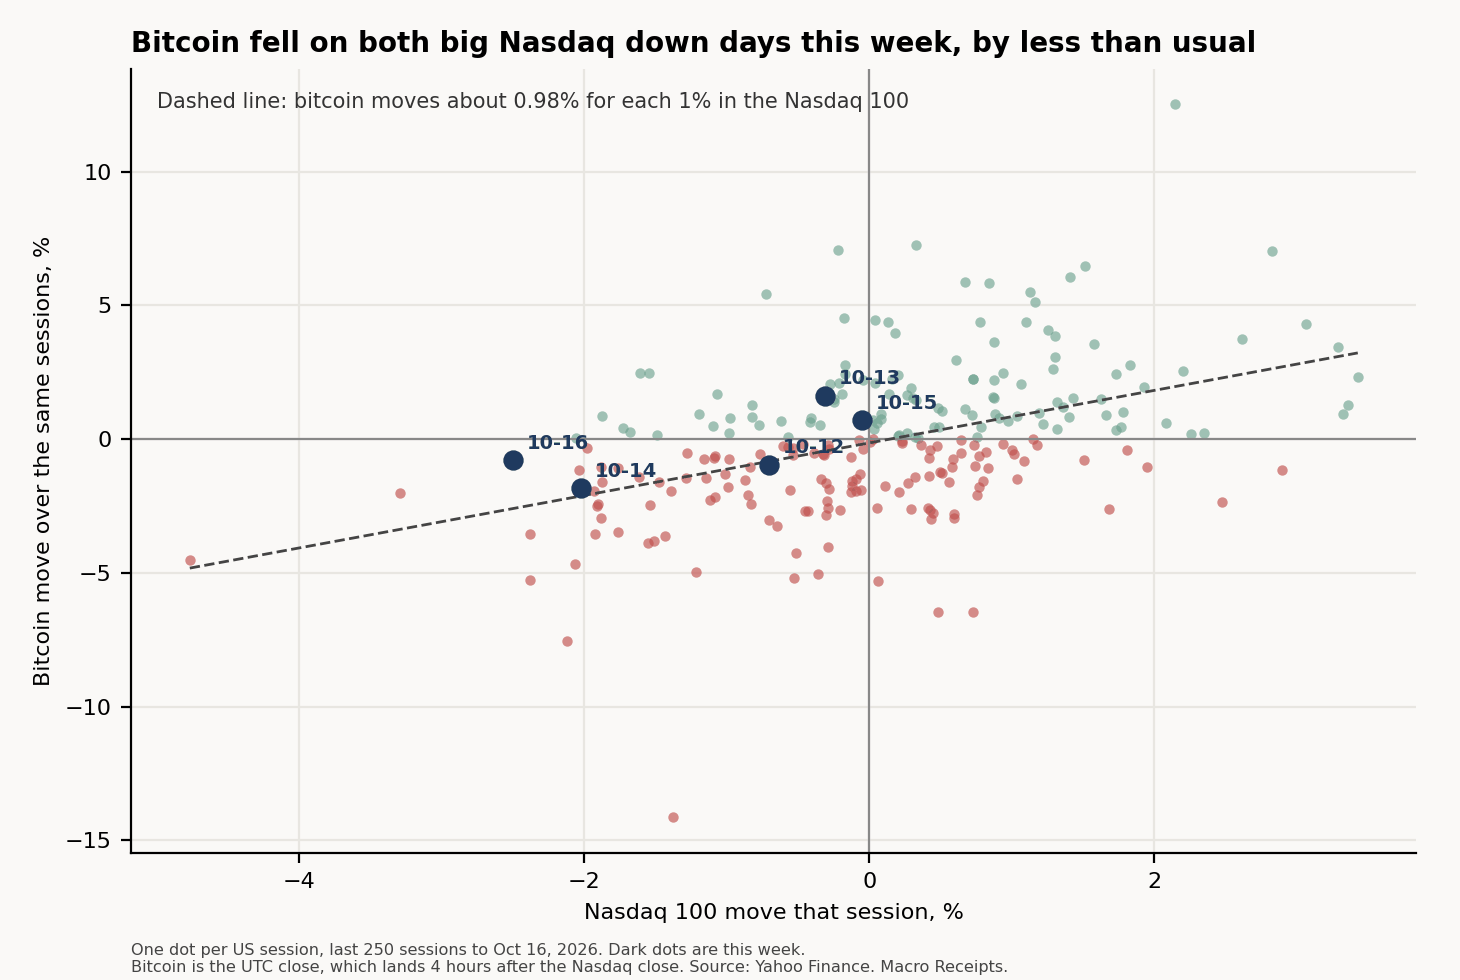
- Over the last 250 sessions, the daily correlation between bitcoin and the Nasdaq 100 is 0.44. Bitcoin has moved about 0.98% for each 1% in the Nasdaq 100.
- Over overlapping five-session windows the fitted line has a slope of 0.85 and a drift term of -0.8 points, because bitcoin has been trending down over this stretch. For a 5.5% Nasdaq 100 drop it predicts about 5.4% down for bitcoin. Drop the drift term and it is still about 4.7%. Bitcoin fell 1.3%. So it did hold up better than usual.
- But it fell on both big Nasdaq days this week: 1.8% on Wednesday (Nasdaq 100 down 2.0%) and 0.8% on Friday (down 2.5%). Across the 250 sessions, the Nasdaq 100 fell 2% or more on 11 days, and bitcoin fell on 10 of them, 3.0% on average.
- In earlier five-session windows where the Nasdaq 100 fell 4% or more, bitcoin averaged about 8.9% down (12 windows, which overlap). Only one, the week of Jul 17 at 0.4% down, held up better than this week.
So: a smaller drop, same direction. One limit of this data: bitcoin's daily close is 4 hours after the stock close, so the two moves do not cover identical hours. Sunday evening bitcoin was around $82,400 on Yahoo, which is a bounce, but it is one week.
What CPI did
Wednesday's September CPI came in hot. Headline was +0.6% on the month and 3.7% on the year, against 0.6% and 3.6% expected. Core was +0.3% and 2.6%, against 0.2% and 2.5% (CNBC). Gasoline rose 9.1% on the month and was about half of the headline gain. The Fed raised 25bp in September, to 3.75%-4%, and its next meeting is Oct 27 and 28.
Wednesday's moves, against Tuesday's closes: Nasdaq 100 down 2.0%, S&P 500 down 1.1%, gold down 1.7%, MSTR down 5.9%, bitcoin down 1.8%. The 10-year yield jumped when the number hit, then closed at 5.19%, 3bp lower on the day.
Thursday's PPI was worse: +6.3% on the year against 5.5% expected (CNBC). Fed Chair Warsh would not signal on rates: "I don't prejudge meetings," he said Thursday (CNBC, AP).
Scorecard
| Last | Change | |
|---|---|---|
| Gold futures | $4,181 | Week -0.8%, year to date -3.7%. 21.4% below the Jan 29 high of $5,318. |
| 10-year Treasury yield | 5.10% | Week -15bp, year to date +93bp. |
| Dollar index | 101.84 | Week -0.4%, year to date +3.6%. |
| S&P 500 | 7,659 | Week -1.9%, year to date +11.9%. 2.0% below the Oct 6 high. |
| Nasdaq 100 | 29,188 | Week -5.5%, year to date +15.6%. 6.5% below the Oct 6 high. |
| Russell 2000 | 2,721 | Week -3.1%, year to date +9.7%. |
| Bitcoin | $81,501 | Week -1.3% to the Friday close, year to date -6.9%. Sunday evening (PT) it was about $82,400. |
| WTI crude | $101.41 | Week +10.4%, year to date +76.6%. Brent closed at $109.86. |
Friday Oct 16 closes. Week is versus the Oct 9 close, year to date versus the Dec 31 close. Yields in basis points (bp). Bitcoin is the UTC daily close, as on the charts. Source: Yahoo Finance daily data.
Bonds and the Fed
The 10-year closed at 5.10%, 15bp below last Friday's 5.24%, even with the hot CPI and PPI. For the year it is still up 93bp. The Fed meets Oct 27 and 28.
Gold
Gold futures closed at $4,181, down 0.8% on the week and 21.4% below its January high. It fell 1.7% on CPI day, which is the opposite of the safe-haven story. This year it has traded against yields, and a hot print that points to higher rates hurts it.
Bitcoin
Bitcoin closed Friday at $81,501 (UTC), down 1.3% on the week, 6.9% below where the year started, and down 2.5% for October. It briefly slipped under $80,000 on Thursday (Decrypt). Saturday closed at $81,382.
A correction to Issue 3: I wrote that bitcoin was 28.4% below "last October's close high of $115,271". That number is the Oct 13, 2025 close, the highest close in the 52-week window I used, not the record. The record close in Yahoo's full BTC-USD history (back to 2014) is $124,753 on Oct 6, 2025. On Issue 3's own date, the Oct 9 close of $82,546 was 33.8% below it. Today's $81,501 is 34.7% below. Sorry for the mistake.
US spot bitcoin ETFs lost $228.6 million this week, after $681.1 million the week before (SoSoValue via Decrypt). Wednesday was the worst day, at $261.4 million out. That is about $615 million out for October so far, in a month people call Uptober. Trackers differ slightly on flows, so treat the exact figures as approximate.
On MSTR: it closed at $136.83, down 11.3% on the week. Friday it dropped 9.6% on $4.35 billion traded, against a $2.56 billion Monday-to-Thursday average. The trigger was a Yahoo Finance report that MSCI's new rules could remove "non-operating" companies like Strategy from its indexes. The final list comes Nov 11, effective after the close on Nov 30. Fundstrat's Sean Farrell estimates around $2 billion of selling across MSCI-linked products, and thinks the market can absorb it (one analyst's estimate, see Notes). IBIT closed at $46.15, down 0.9%.
US tech
The Nasdaq 100 fell 5.5% to 29,188. The Nasdaq composite fell 4.5%, its worst week since late June (Investing.com). Tech stocks lost more than $1 trillion on Friday alone, and the Philadelphia semiconductor index fell for an eighth straight day, the longest streak since 2008 (NBC). Memory chips led it down after a report of a Chinese advance in memory: Micron down 14.6%, Samsung 17.8% and SK Hynix 24.3% on the week (Investing.com, single source).
Nvidia fell 6.6% to $214.13, Tesla 7.3% to $354.72, Amazon 4.7%, Alphabet 3.1%, Meta 1.3% to $709.33 and Microsoft 1.1% to $529.05. Apple rose 2.0% to $343.46.
Oil did not help. Brent closed at $109.86, its highest close since May 19, and WTI rose 10.4% on the week. Nine or more ships have been attacked near Hormuz since last Sunday, and Hormuz exports run at about 70% of prewar levels (Kpler via CNBC). JPMorgan reported Q3 EPS of $5.57, a miss against analyst estimates of $5.90 (CNBC, LSEG) to $5.93 (AP).
This week
- Tue, Oct 20: GM earnings.
- Wed, Oct 21: Meta and Tesla earnings.
- About 70 S&P 500 companies report this week. Alphabet, Microsoft and Amazon report the following week, and Apple on Nov 2.
With Meta and Tesla both down on the week going into earnings, the Mag 7 line on Chart 2 should get interesting. I will check the dollars again next Monday.
The close
That is issue four. If a number is wrong, reply and tell me. I read every reply and fix mistakes in the open, like the one above. Next Monday: what the Meta and Tesla reports did to all of this.
Kumar
Sources and method
- Prices and volumes: Yahoo Finance daily history for BTC-USD, MSTR, IBIT, FBTC, ARKB, BITB, GBTC, BTCO, HODL, BRRR, EZBC, BTCW, NVDA, MSFT, AAPL, GOOGL, AMZN, META and TSLA, plus index, gold, oil, dollar and yield series, retrieved Oct 18, 2026 (finance.yahoo.com). Dollar volume = daily close times share volume (BTC-USD volume is already in dollars). Unofficial source, credited. The record-close check uses the full BTC-USD daily history.
- Matched sessions: only dates when US equities traded; each weekly average is per session. Gross trading across all channels overlaps and is not net flows.
- Correlation, slope and window figures are my calculations from the same Yahoo daily data.
- CPI figures, the Fed's September hike and the Oct 27-28 meeting: CNBC, Oct 14, "Consumer prices rose 3.7% annually in September as gas prices skyrocket"
- PPI, 10-year yield and Warsh's comments: CNBC, Oct 16, "U.S. Treasury yields waver as traders wrap up volatile week"
- Brent close, Hormuz attacks and exports: CNBC, Oct 16, "U.S. crude oil tops $100 as Iran escalates Hormuz attacks"
- Tech selloff and semiconductor streak: NBC News, Oct 16, "Tech stocks erase $1 trillion of wealth as oil surges to $110"
- Nasdaq composite week and memory-chip losses: Investing.com, Oct 16, "Nasdaq notches worst week since late June with a 4.5% slide"
- MSCI rules, Strategy and the Fundstrat estimate: Yahoo Finance, Oct 16, "Strategy stock falls 10% as Michael Saylor's bitcoin giant faces index-level threat"
- ETF flows and the $80,000 dip: Decrypt, "Bitcoin ETFs shed nearly $1 billion in two weeks"
- JPMorgan results: CNBC, Oct 13, "Bank earnings October 2026: Live updates" and AP, Oct 13
- Warsh: AP, Oct 16, "Fed chair Warsh pledges price stability but avoids hints about rates"
- Week ahead: CNBC, Oct 18, "Meta, Tesla earnings preview: Week of Oct. 19" and Investopedia
Not investment advice. Charts and numbers are for information only.