Bitcoin made a new price high. Its trading engine has had a harder time finding a higher gear.
That was my question after plotting twelve years of dollar trading volume. The climb before 2021 is striking. Since then, the line looks much less convincing. Compare it with Nvidia and the gap gets hard to ignore.
But the first explanation was too simple. Bitcoin volume has not been flat at $30 billion a day since 2021. It fell, recovered, and slowed again. Adding ETFs and Strategy shares gives us a fuller picture. The question that survives those checks is whether trading activity has kept up with the asset's size.
The long view
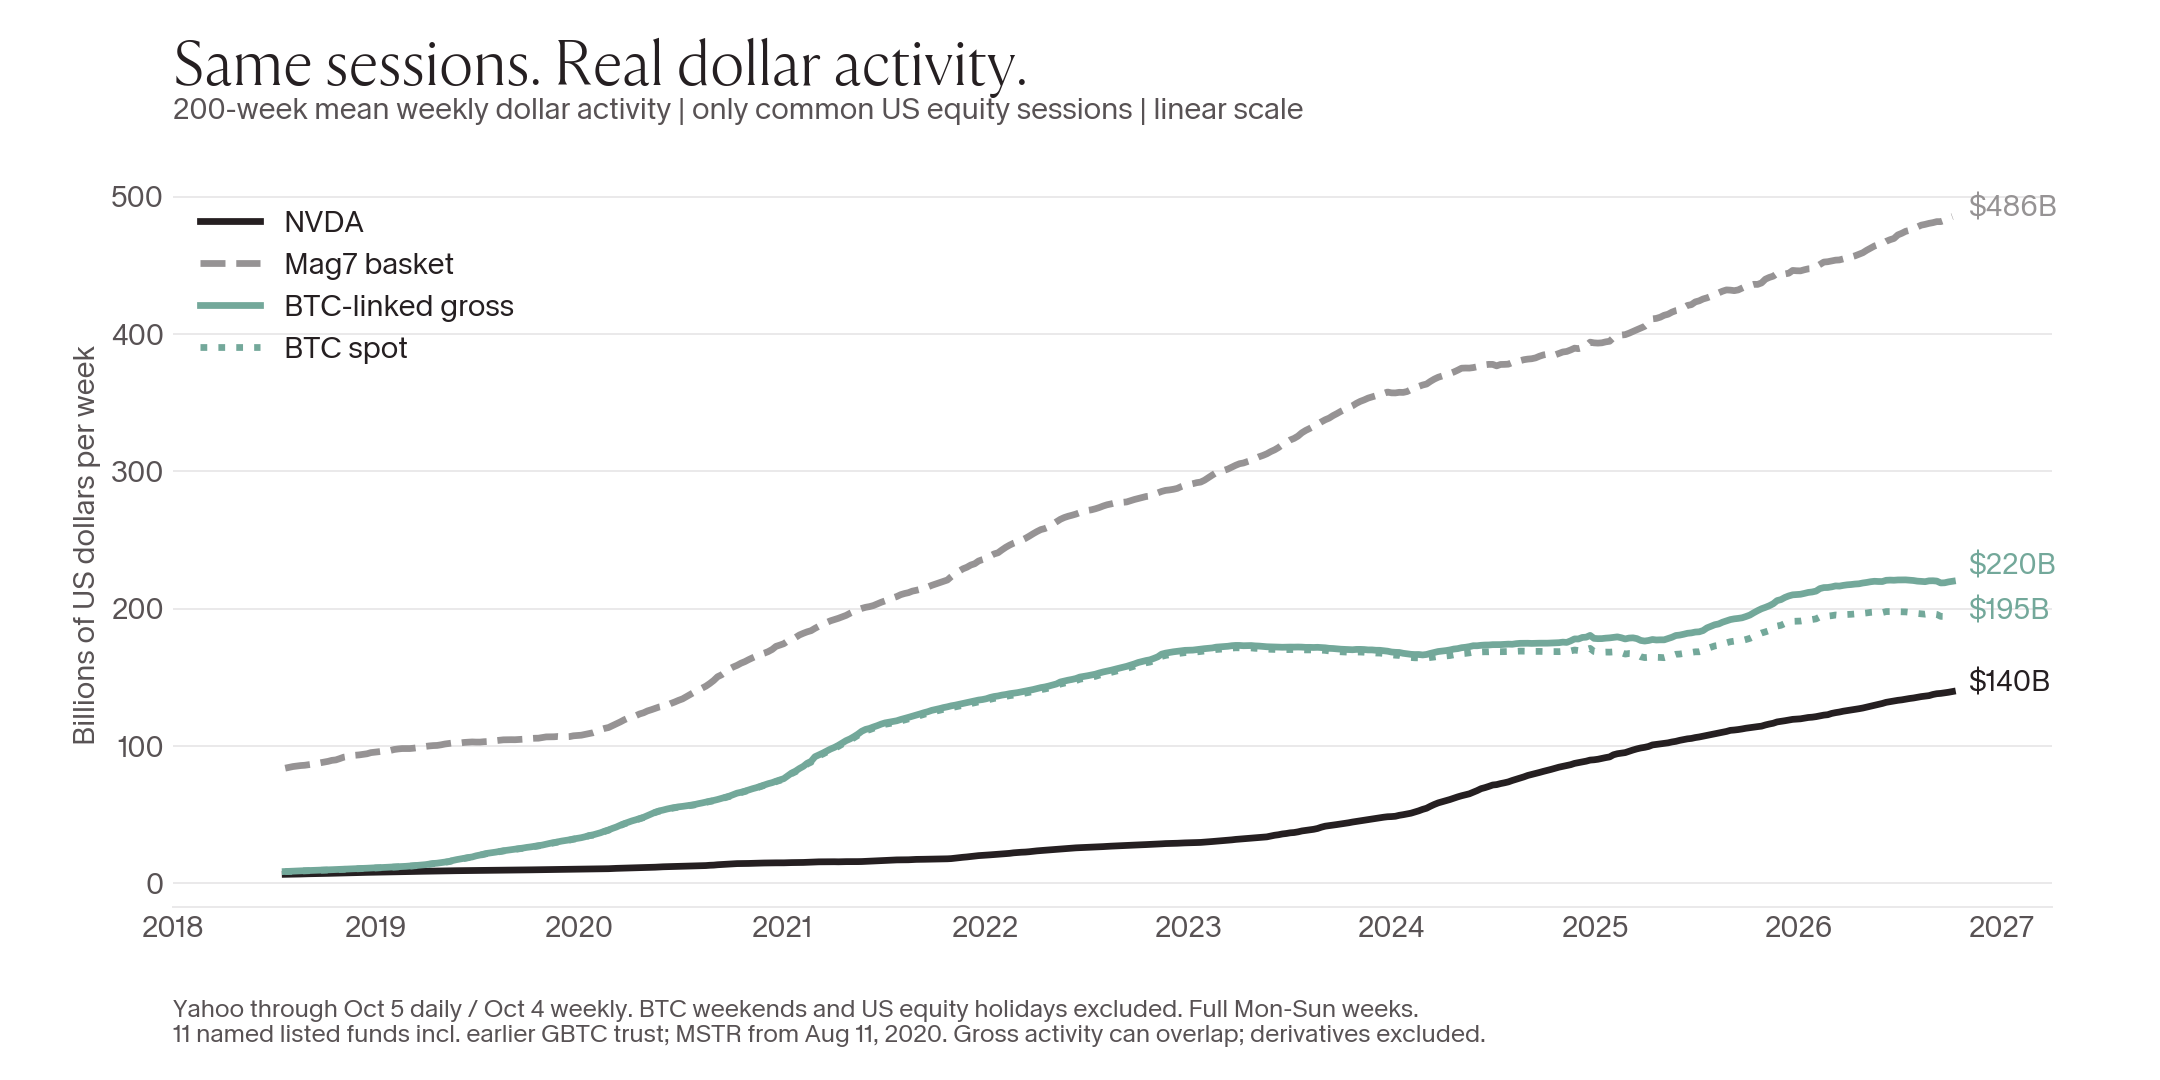
I pulled daily Yahoo Finance history, kept only dates when all seven selected equities traded, summed that dollar activity into complete weeks, and took a 200-week simple moving average. Bitcoin weekends and US equity holidays are excluded. Each weekly sum includes only these matched sessions, and each 200-week average uses the same calendar horizon. The chart shows actual billions of dollars per week on a linear scale, not an index.
Through October 4, 2026, Bitcoin's spot average is $195.15 billion per matched week. Add eleven selected US spot funds and MSTR, and gross BTC-linked activity is $219.95 billion. The seven-ticker Magnificent Seven basket is $485.60 billion. Nvidia alone is $139.66 billion. These are average weekly trading amounts, not market values or net money entering the assets.
Nvidia is the standout, not a stand-in for every large stock. Amazon's 200-week dollar-volume average is below its end-2021 level. Tesla's latest 13-week trend is slightly negative. The basket is growing, but the picture is uneven.
Bitcoin's reported spot volume had an annual matched-session mean of $49.68 billion in 2021. The same measure fell to $20.54 billion in 2023, recovered to $59.79 billion in 2025, and stands at $40.18 billion for 2026 through October 5.
That 2025 recovery matters. Its matched-session annual mean exceeded 2021 by 20.3%. Calling the entire period a flat line would hide a real cycle.
Where did MSTR and IBIT go?
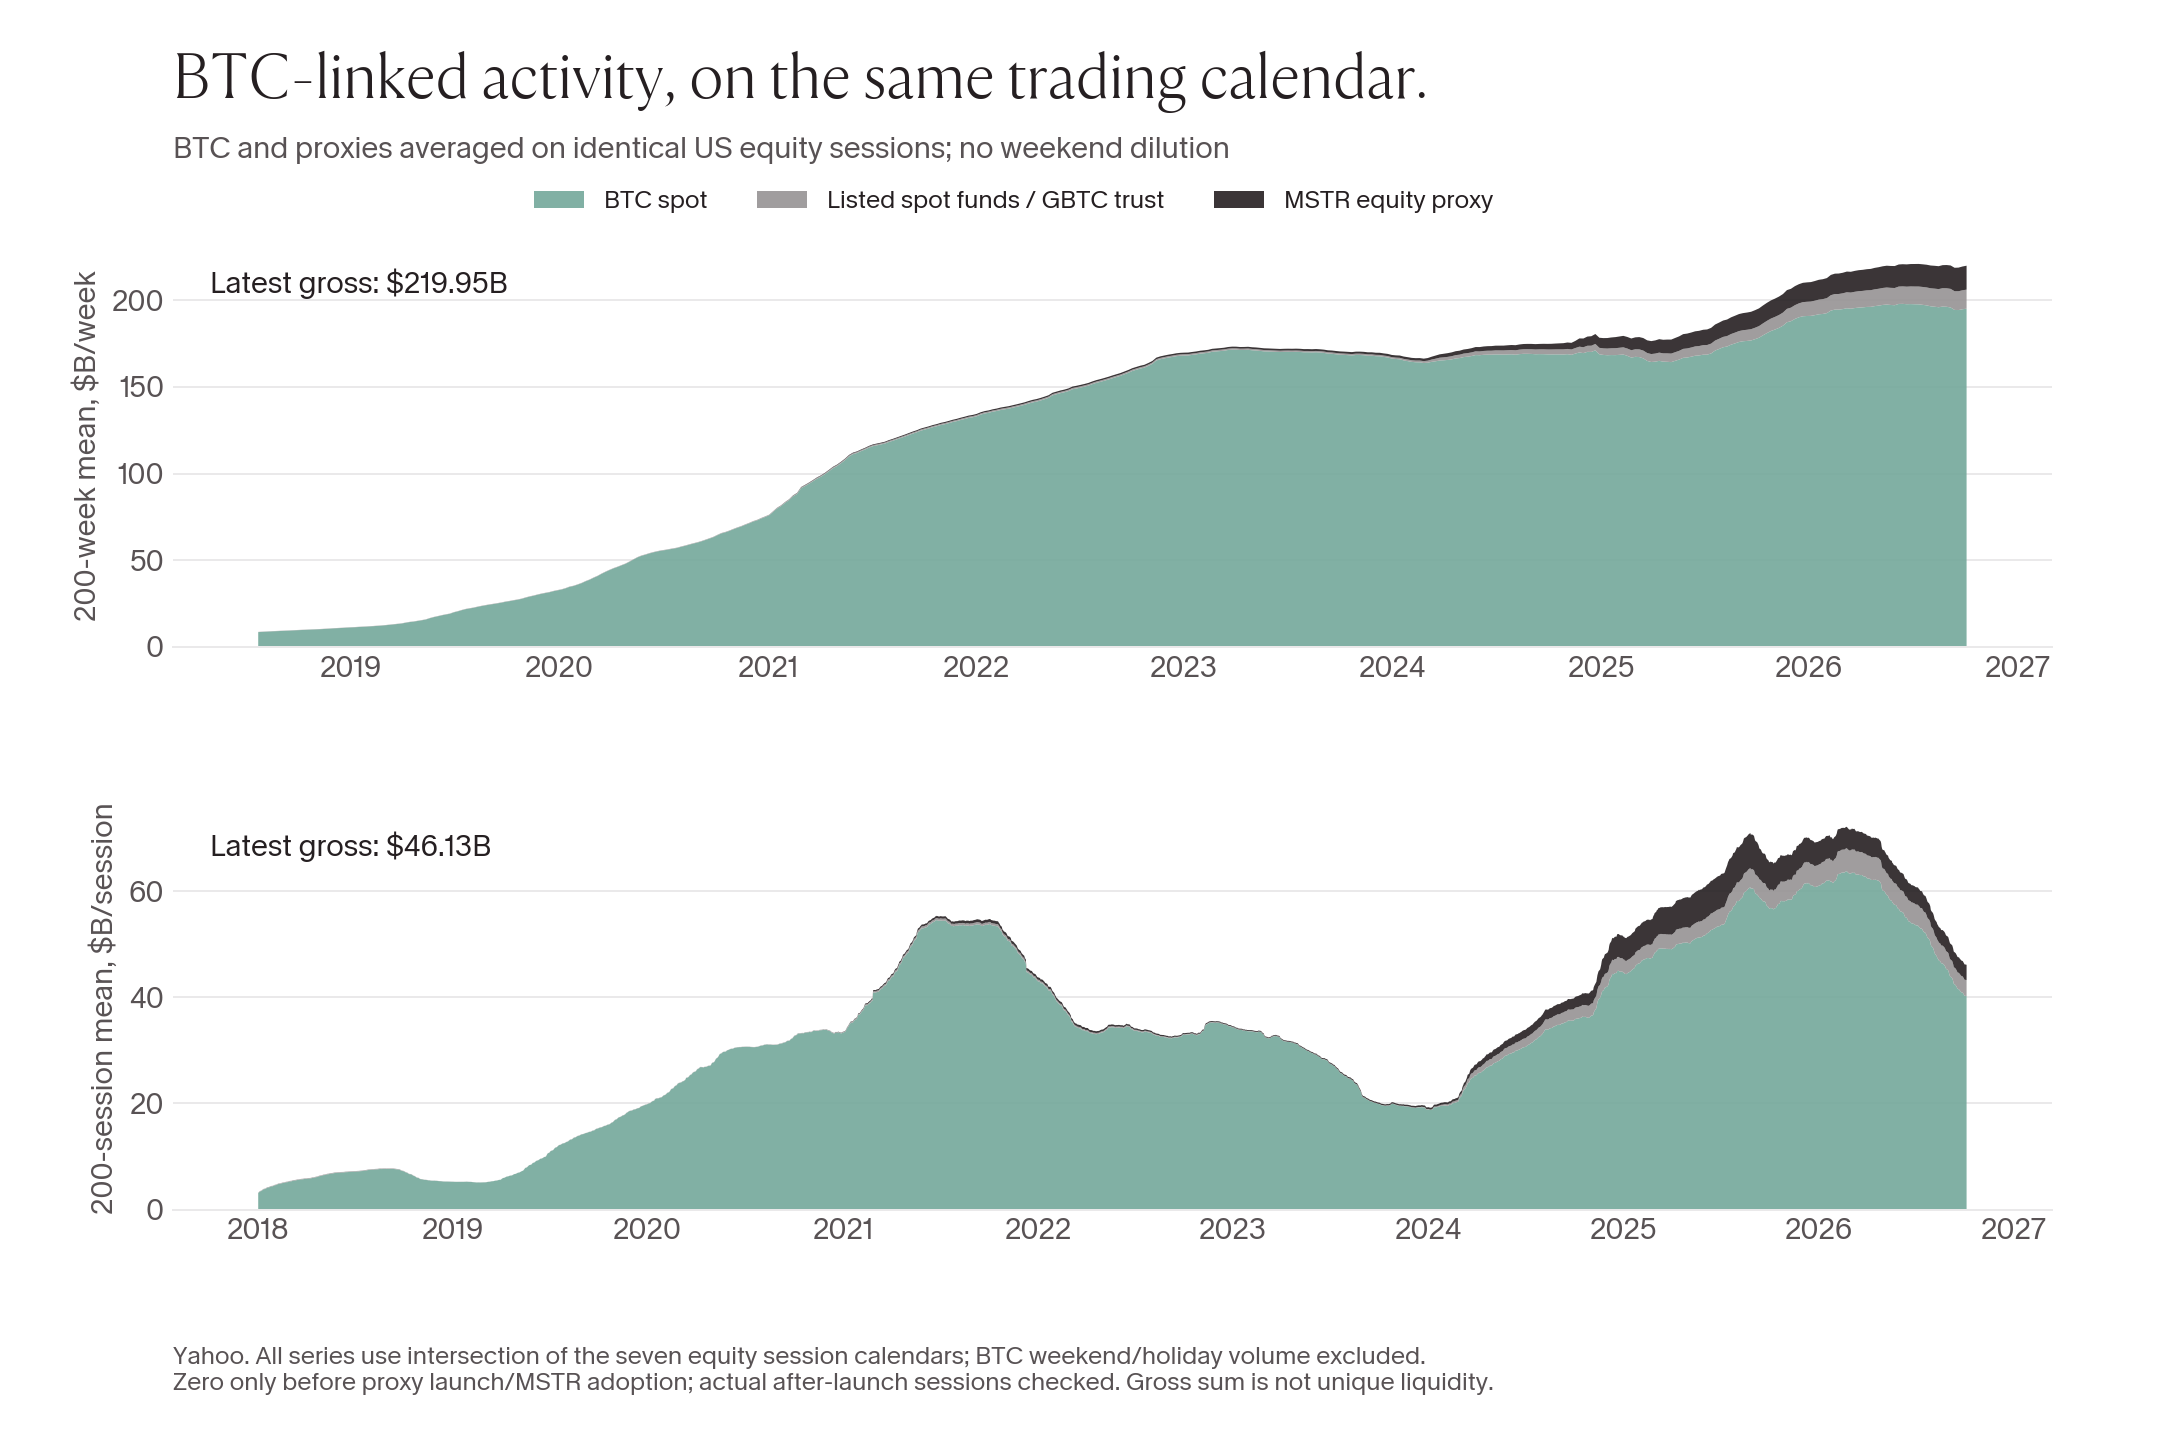
They belong in the picture. Billions of dollars trade through these instruments, and leaving them out understates how BTC-linked markets have grown.
The scale still matters. Across the latest 200 common US equity sessions, reported BTC spot activity averages $40.23 billion per session. The selected spot-fund panel adds $3.01 billion. MSTR adds $2.89 billion. The gross sum is $46.13 billion per session, 14.7% above spot alone.
IBIT alone is about $2.20 billion per session within that fund panel. These are all measured on the same dates. Bitcoin continues to trade on excluded weekends and holidays; this comparison deliberately leaves those trades out. It is a matched-calendar comparison, not the entire Bitcoin trading week.
The new channels have more impact on growth than their current share alone suggests. Gross BTC-linked activity averaged $68.35 billion per matched session in 2025, versus $50.56 billion in 2021. That is 35.2% growth, versus 20.3% for spot alone.
Even so, adding them does not erase the contrast with Nvidia. On the 200-week measure, they lift the current level by 12.7%. Over the latest thirteen weeks, spot's long average fell 1.29%; the gross BTC-linked average fell 0.45%. The extra channels soften the slowdown.
This sum needs a careful name: gross BTC-linked trading activity. ETF market makers may hedge in spot, so activity can overlap. MSTR is a corporate equity with leverage, dilution and valuation effects. Neither can be treated as fresh dollars entering Bitcoin. The total is a view of trading channels, not a double-count-free measure of liquidity.
Price grew faster than trading
Bitcoin's 2021 high in the Yahoo series was about $68,790. The later high was $126,198 in October 2025. There was a substantial post-2021 price rally. I would not call that "no real bull market."
The more interesting result is volume relative to market capitalization. Using Yahoo price and volume with Coin Metrics circulating supply, average daily reported spot turnover across all calendar days was 5.55% of market cap in 2021. In 2025 it was 2.61%, about 53% lower.
Average price more than doubled between those years. Dollar volume grew only 12.4% across all calendar days, or 20.3% on matched equity sessions. Trading activity recovered, but did not keep pace with valuation.
Lower turnover does not automatically mean worse liquidity or weaker adoption. More investors may simply hold. Executable liquidity depends on depth, spreads and slippage, not just how much traded yesterday. Kaiko's research after the ETF launch found improved Bitcoin order-book depth on US venues, even as spread results were mixed.
The flip is worth watching. The prediction needs proof.
A sustained upward turn in the long volume average would be worth paying attention to. It would tell us that recent weekly activity is beating the older activity leaving the window.
I tested a simple definition: the 200-week average must be above its value thirteen weeks earlier for four consecutive weekly readings. Count the signal only at the fourth reading, and impose a 26-week cooldown.
There were only three confirmed turns in the matched-session history. After May 12, 2024, Bitcoin gained 69.4% over the next 52 weeks. After December 8, 2024, it lost 10.5%. After June 29, 2025, it lost 44.0%. Returns use Bitcoin's close on the last matched equity session of each week. These are confirmation dates, not dates chosen afterward to match price bottoms.
Three mixed episodes do not establish a timing signal. These rules were chosen for an exploratory check, not validated out of sample. Changing from full-week Bitcoin volume to matched-session volume also changes the signal dates, another reason to be careful. Yahoo's Bitcoin history begins in September 2014, so the first complete 200-week point arrives only in July 2018. Earlier-cycle turns are missing.
There is a mechanical trap too. A 200-week average can turn up when a weak old week drops out, even without a sudden pickup in current trading. The latest matched-session spot average remains down over thirteen weeks. One uptick is a thin basis for calling material outperformance.
What I want to see next
The case I want to make is about market development. For a much larger Bitcoin market, sustained trading activity, more capacity to absorb large orders, and smaller execution costs would be encouraging.
The 200-week volume profile is one receipt. It belongs beside same-venue order-book depth, spreads, ETF share activity and Bitcoin-specific derivatives data. A rising line would strengthen the case. It would not finish it.
For now, the evidence says Bitcoin's trading activity grew more slowly than its price and much more slowly than Nvidia's. ETFs and MSTR improve that picture. They do not turn it into the same growth story.
Data notes and receipts
All market calculations use Yahoo daily bars retrieved October 6, 2026. Daily analysis excludes the partial October 6 bar; weekly analysis ends October 4. Comparison charts use the intersection of actual trading dates for the seven selected equity tickers; BTC weekends and US market holidays are removed. The 200-week calculation averages matched-session weekly sums, not 200 trading sessions. The separate market-cap-turnover comparison uses all calendar days. Equities use split-adjusted Close multiplied by share Volume, a closing-price estimate of dollar turnover rather than exact trade-by-trade notional. Bitcoin's reported Volume is already USD-denominated aggregate spot activity; it is not multiplied by price again.
The equity basket is AAPL, AMZN, GOOGL, META, MSFT, NVDA and TSLA. It uses seven ticker lines, not every share class. The fund panel is IBIT, FBTC, GBTC, ARKB, BITB, HODL, BRRR, BTCO, EZBC, BTCW and BTC (Grayscale's mini trust). GBTC includes its earlier listed-trust history. MSTR enters on August 11, 2020, its first disclosed Bitcoin treasury purchase. Only actual common equity sessions enter the ecosystem sum. Pre-launch dates contribute zero; after-launch fund session coverage was checked for missing dates. MSTR is excluded before its BTC treasury adoption. New instruments change coverage over time.
This is not all global BTC-linked trading. Bitcoin derivatives are excluded because a comparable BTC-only daily history was not reconstructed. CoinMarketCap's aggregate coverage and filtering have evolved, so the full historical series should not be treated as a constant set of venues. Stablecoin-quoted pairs are not simply absent: the provider's method converts quote-currency volume to USD. Turnover uses total circulating supply, not free float. The supply archive ends May 23, 2026; annual turnover comparisons above use complete 2021 and 2025 data.
Data retrieved from Yahoo Finance on October 6, 2026. Yahoo Finance and underlying providers retain data rights; this article does not redistribute raw histories. Research commentary, not a forecast or investment recommendation.