Every week I post the same chart on X: bitcoin ETF flows. The latest one shows $442M of net outflows in the most recent week of data, against $54.8B of cumulative net inflows since the US spot ETFs launched in January 2024. One red week, one very large line. This piece is the receipts behind that chart: where the numbers come from, how each one gets checked before it posts, and what two years of flows actually say.
What two years of flows look like
The top panel is the cumulative line: every dollar of net flow into every US spot bitcoin ETF, added up day by day since launch. It first crossed $50B on July 9, 2025, peaked at $62.7B on October 9, 2025, and sits at $54.8B as of September 16, 2026.
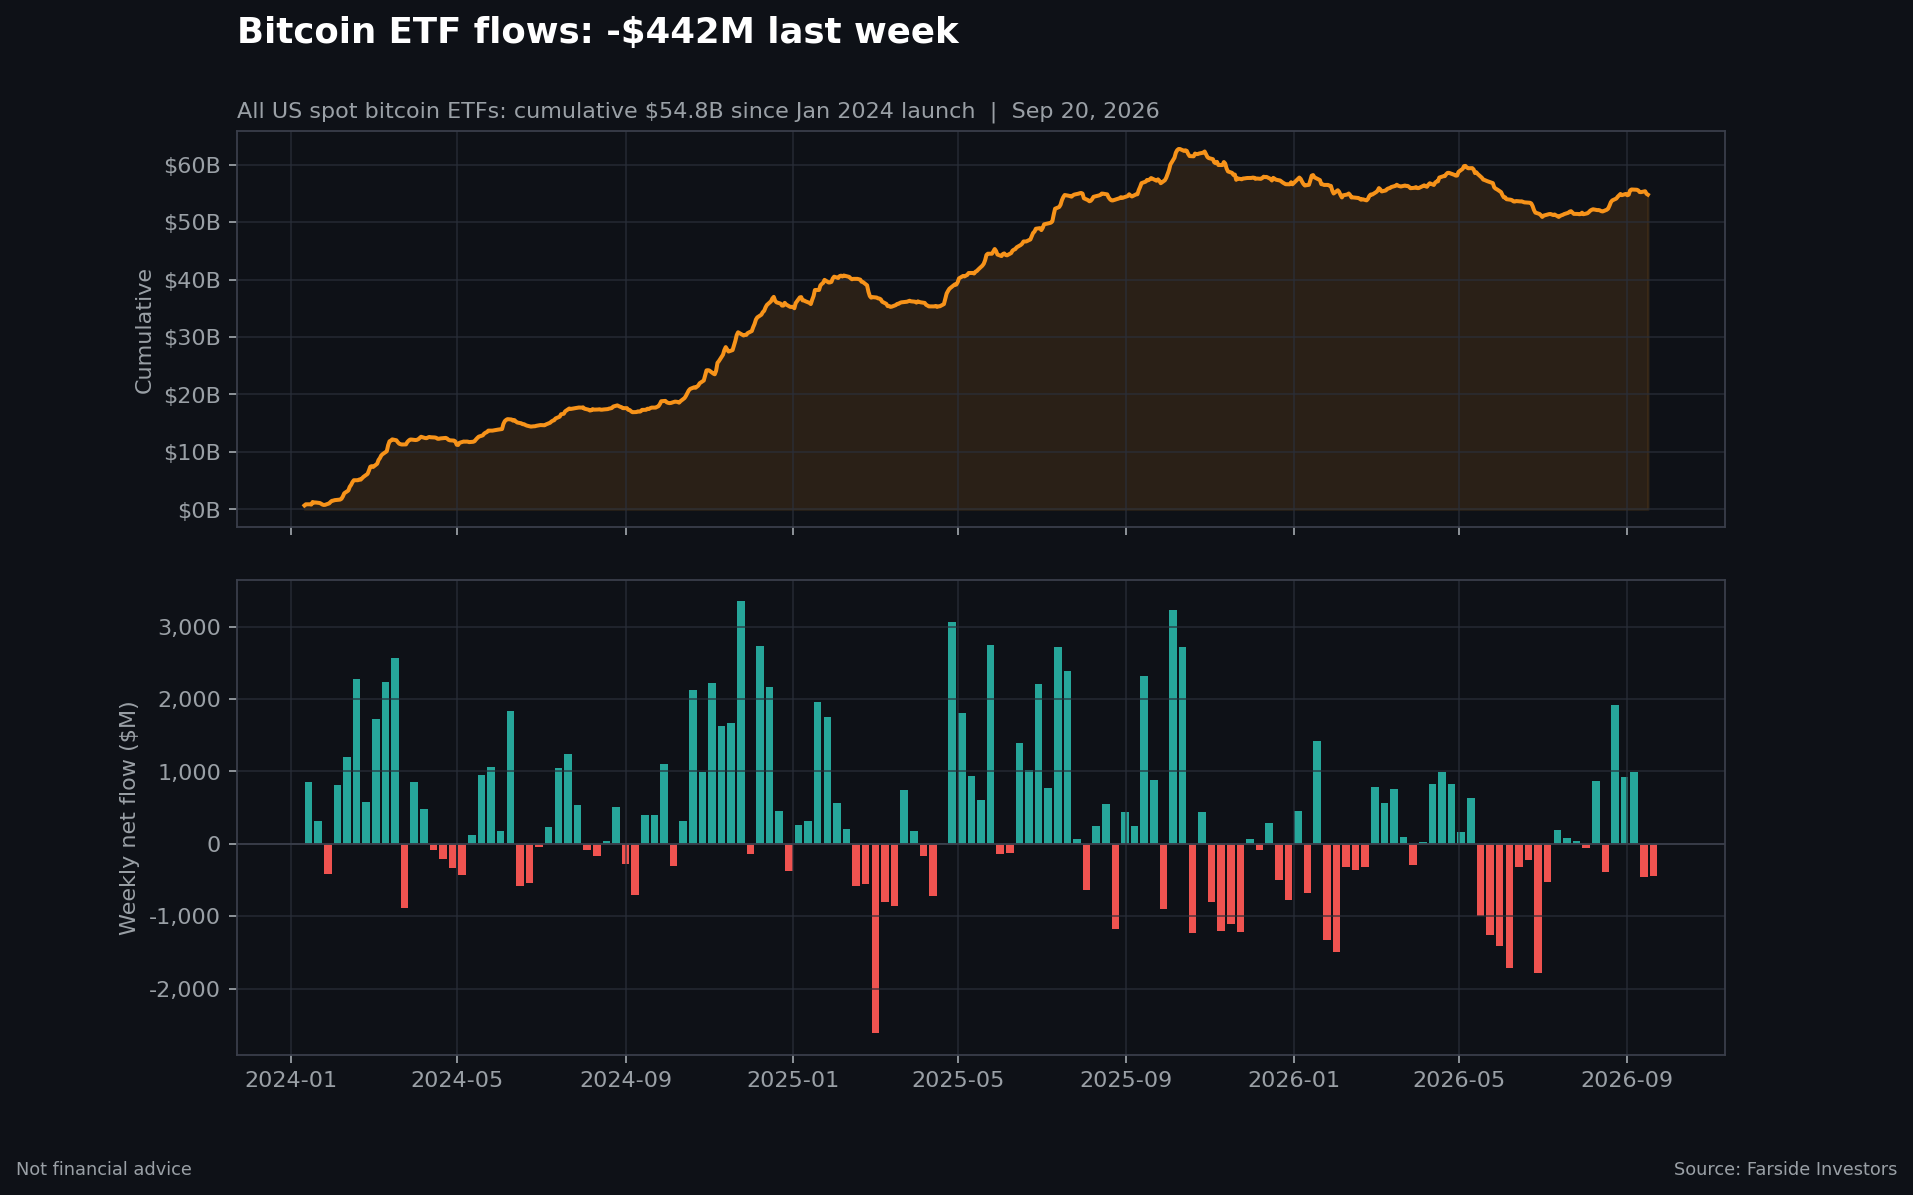
The bottom panel is the same data week by week. Out of 141 weeks since launch, 86 were inflow weeks and 55 were outflow weeks. The best week brought in $3.35B (November 24, 2024). The worst lost $2.62B (March 2, 2025). A $400M red week looks dramatic on a timeline. On this chart it is a normal week.
2026 has been the choppiest stretch so far: 19 inflow weeks, 19 outflow weeks, about -$1.8B net year to date. The easy one-way bid from 2024 and early 2025 is gone, and weekly prints now swing both ways.
How every number gets checked
The source is the daily flow table that Farside Investors publishes for each US spot bitcoin ETF. A parser pulls that table into a daily CSV, sums the funds into a total per day, aggregates days into weeks, and builds the cumulative path from the daily totals. The code and the data live in a public repo, one folder per chart, so any number I post can be recomputed from scratch.
The check is the part I care about most. Before anything posts, a script recomputes each claim directly from the committed daily CSV: every weekly total and the full cumulative path, date by date, not just the final value. If an edit to a derived file would make a posted claim wrong, the build fails in CI. It also warns when a number rests on a partial week or a day where some funds have not reported yet, because Farside marks those days provisional.
If you want to audit the work, clone the repo, run the tests and the verification script, and you get the same numbers I post. That is the point of putting the pipeline in public: the chart is the opinion, the repo is the receipt.
How I read it
Weekly flows are noisy. The cumulative line is what I watch: is the marginal ETF buyer still accumulating? Through 2024 and most of 2025 the answer was an unambiguous yes. In 2026 the honest answer is no, not on net. The line has given back roughly $8B from the October 2025 peak and has moved sideways between about $51B and $58B all year.
That read matters more than any single green or red week. When the cumulative line starts making new highs again, the flow regime has changed. Until then I expect more of what 2026 has delivered: sharp up weeks, sharp down weeks, and a line that goes nowhere fast. I will keep posting the chart every week either way, from the same checked pipeline.